Key performance indicators
The Board uses a range of financial and non-financial indicators to monitor Group and segmental performance in line with the strategy described in the Business review - Our strategy. These indicators are chosen to monitor both current performance and the success of investments that will sustain and enhance future performance. Key performance indicators are included in the appropriate sections of the business review and are as follows:
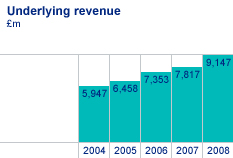
Monitoring of revenues provides a measure of business growth. Underlying revenues are used in order to eliminate the effect of the decision not to adopt hedge accounting and to provide a clearer year-on-year measure. The Group measures foreign currency sales at the actual exchange rate achieved as a result of settling foreign exchange contracts from forward cover.
Underlying profit before financing
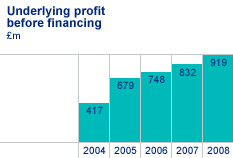
Underlying profit before financing is presented on a basis that shows the economic substance of the Group’s hedging strategies in respect of the transactional exchange rate and commodity price movements. In particular, (a) revenues and costs denominated in US dollars and euros are presented on the basis of the exchange rates achieved during the year, (b) similar adjustments are made in respect of commodity derivatives, and (c) consequential adjustments are made to reflect the impact of exchange rates on trading assets and liabilities and long-term contracts on a consistent basis. The derivation of underlying profit before financing is shown in note 2 of the consolidated financial statements.
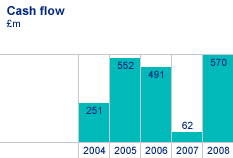
In a business requiring significant investment, the Board monitors cash flow to ensure that profitability is converted into cash generation, both for future investment and as a reward for shareholders. The Group measures cash flow as the movement in net funds/debt during the year, after taking into account the value of derivatives held to hedge the value of balances denominated in foreign currencies. The figure in 2007 is shown after reflecting a £500 million special contribution to the Group’s UK pensions schemes, as part of the restructuring of its pensions schemes.
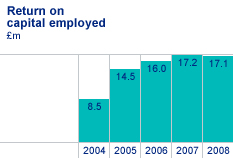
Return on capital employed is calculated as the after-tax underlying profit, divided by the average net assets during the year, adjusted for net cash, the net post-retirement deficit and goodwill previously written off. It represents a measure of the return the Group is making on its investments.
Net research and development charge
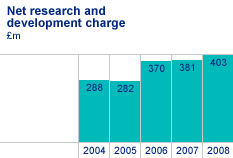
Investment in research and development underpins all the elements of the Group’s strategy. Programme expenditure is monitored in conjunction with a gated review process on each programme and progress is reviewed at key milestones.
Gross research and development expenditure
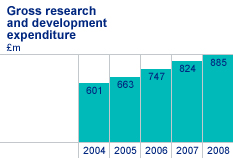
The Group’s research and development activities comprise both self-funded and customer funded programmes. Gross expenditure measures the total research and development activity and is an indicator of the effectiveness of the actions taken to continuously improve the Group’s intellectual property.
Net research and development expenditure as a proportion of underlying revenue
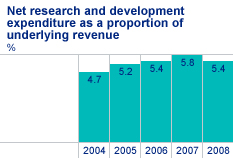
Research and development is measured as the self-funded expenditure before both amounts capitalised in the year and amortisation of previously capitalised balances. The Group expects to spend approximately five per cent of revenues on research and development although this proportion will fluctuate annually depending on the stage of development of current programmes. This measure reflects the need to generate current returns as well as to invest for the future.
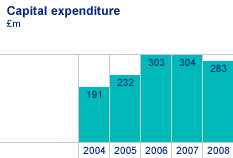
To deliver on its commitments to customers, the Group invests significant amounts in its infrastructure. All investments are subject to rigorous review to ensure that they are consistent with forecast activity and will provide value for money. Annual capital expenditure is measured as the cost of property, plant and equipment acquired during the period.
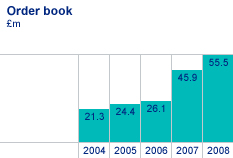
The order book provides an indicator of future business. It is measured at constant exchange rates and list prices and includes both firm and announced orders. In civil aerospace, it is common for a customer to take options for future orders in addition to firm orders placed. Such options are excluded from the order book. In defence aerospace, long-term programmes are often ordered for only one year at a time. In such circumstances, even though there may be no alternative engine choice available to the customer, only the contracted business is included in the order book. Only the first seven years’ revenue of long-term aftermarket contracts is included.
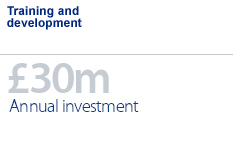
Training is a core element of the Group’s investment in its capability and is measured as the expenditure on the training and development of employees, customers and suppliers. Effectiveness is ensured by using a range of external and internal sources, and by gathering user feedback.
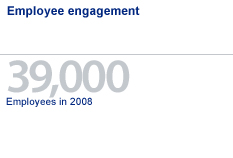
Regular surveys are undertaken to identify and address emerging issues. A full employee engagement survey is run every two years with smaller pulse surveys in between. Training and employee engagement surveys are discussed further in the corporate responsibility section of this review.
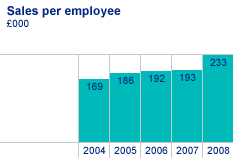
A measure of personnel productivity, this indicator measures published revenue generated per employee.
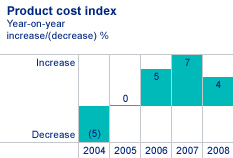
Unit costs are a key determinant of the Group’s ability to deliver its commitments on a profitable basis. The Group monitors the year-on-year change in the actual average unit product cost of its gas turbine operations and seeks over time to improve productivity in all owned facilities and those of its suppliers.
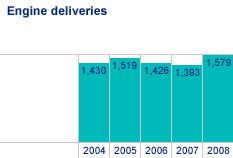
The Group’s installed engine base represents an opportunity to generate future aftermarket business. This is measured as the number of Group products delivered during the year within each business except for marine, as its products do not lend themselves to this measure due to their diversity.
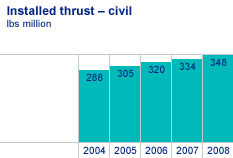
Installed thrust is the indicator of the amount of product in use by our customers and therefore the scale of opportunity this presents for our services business.
Percentage of civil fleet under management

Long-term contracts are an important way of generating value for customers. The percentage of fleet under management gives a measure of the proportion of the installed base where the future aftermarket arrangements are agreed under long-term contracts. This is measured as the percentage of gas turbines and submarine propulsion units where the Group has contracted a long-term service arrangement. In civil aerospace, marine and energy, the percentage is weighted to reflect the value of the equipment under management. The figure shown for civil aerospace for 2004 differs from that disclosed in the Annual report for that year as a result of reflecting this weighting.
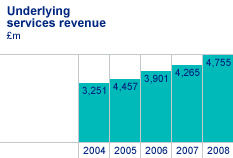
Underlying services revenue shows the amount of business during the year that has been generated from the installed engine base. This is measured as the revenue derived from spare parts, overhaul services and long-term service arrangements.

Much of the research and development expenditure is focused on reducing emissions of the Group’s products. The Group measures both the emissions of its products and the emissions of its manufacturing operations. These measures are described in detail in the environment report, ‘Powering a better world’, which is available on the Group’s website, www.rolls-royce.com.